Frequency & Frequency Tables
Frequency is the number of times a partciaular value of data occurs.
For example: say we ask \(10\) people which color they prefer between blue, red and green. The answers we get are:
- frequency of blue: \(5\)
- frequency of green: \(2\)
- frequency of red: \(3\)
The objective of this section is to know how to construct frequency tables for both:
- Qualitative Data
- Discrete Quantitative Data.
Note: if you're unsure what these two types of data are, make sure to read through the previous section in which we define the different types of data.
We start by watching a tutorial to learn the method. We then work through some exercises.
Method
-
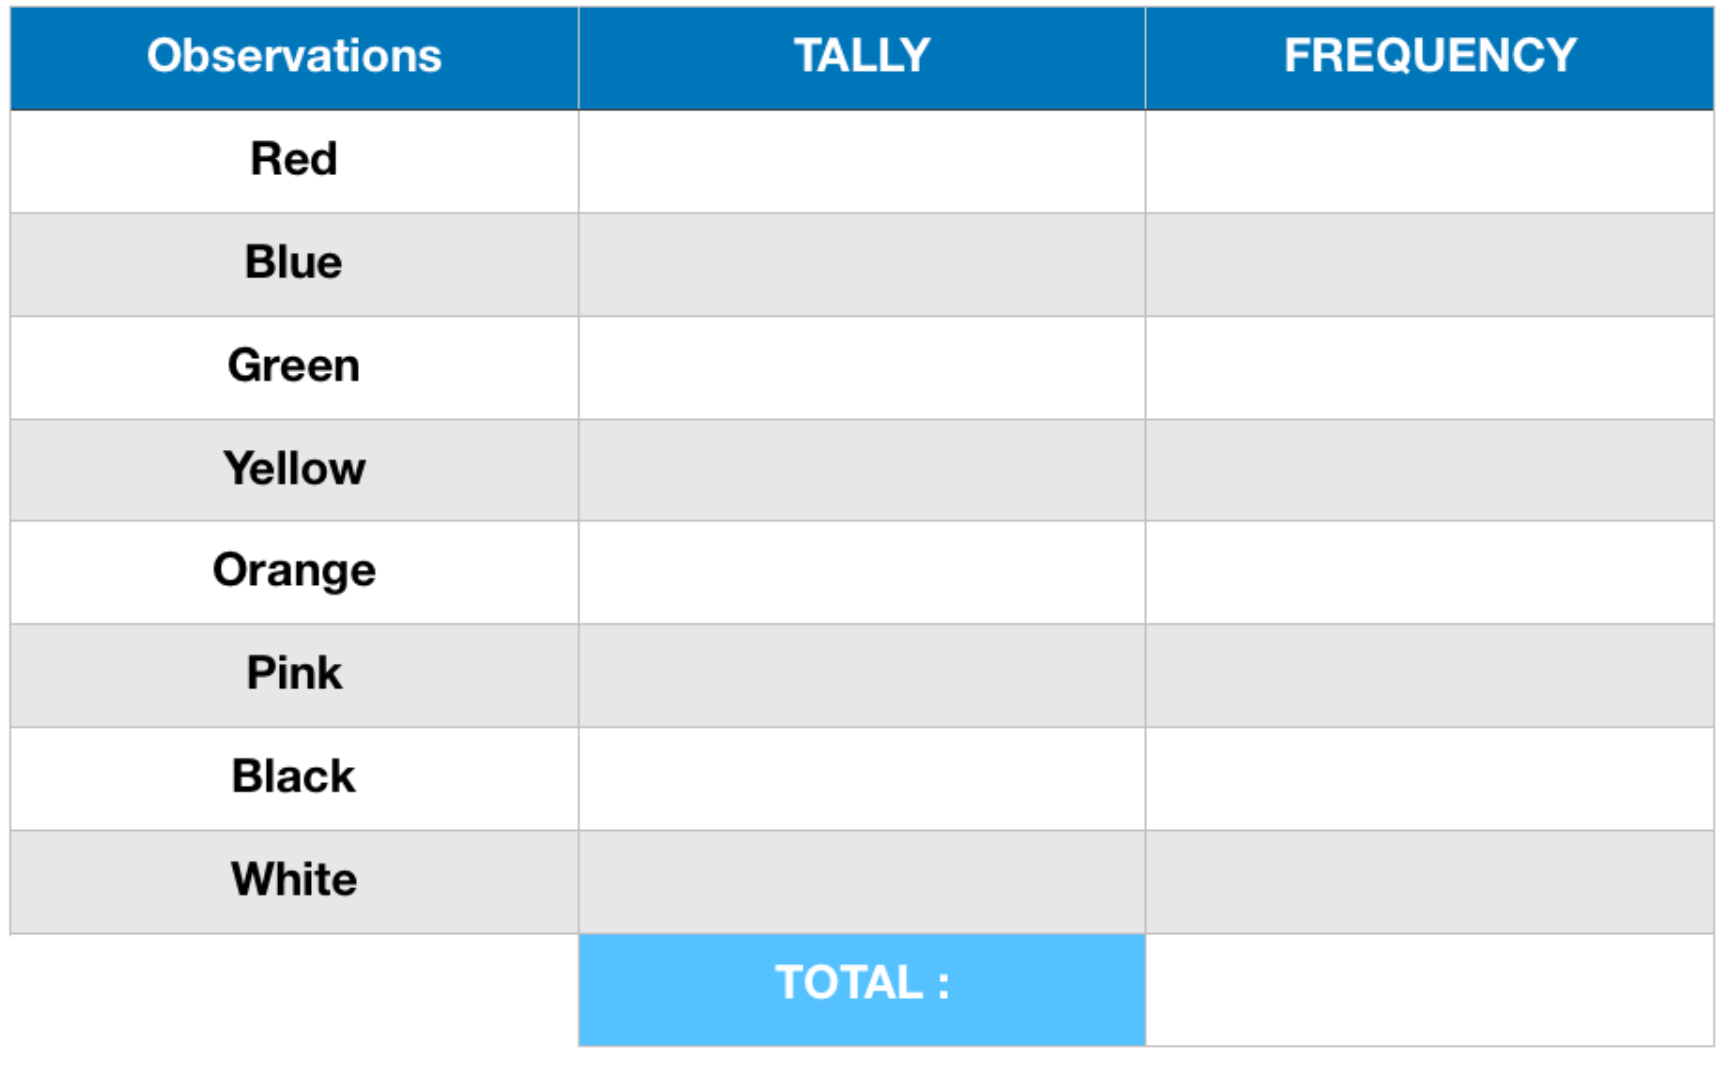
Step 1: Contruct a table with \(3\) columns named:
- Observations
- Tally
- Frequency
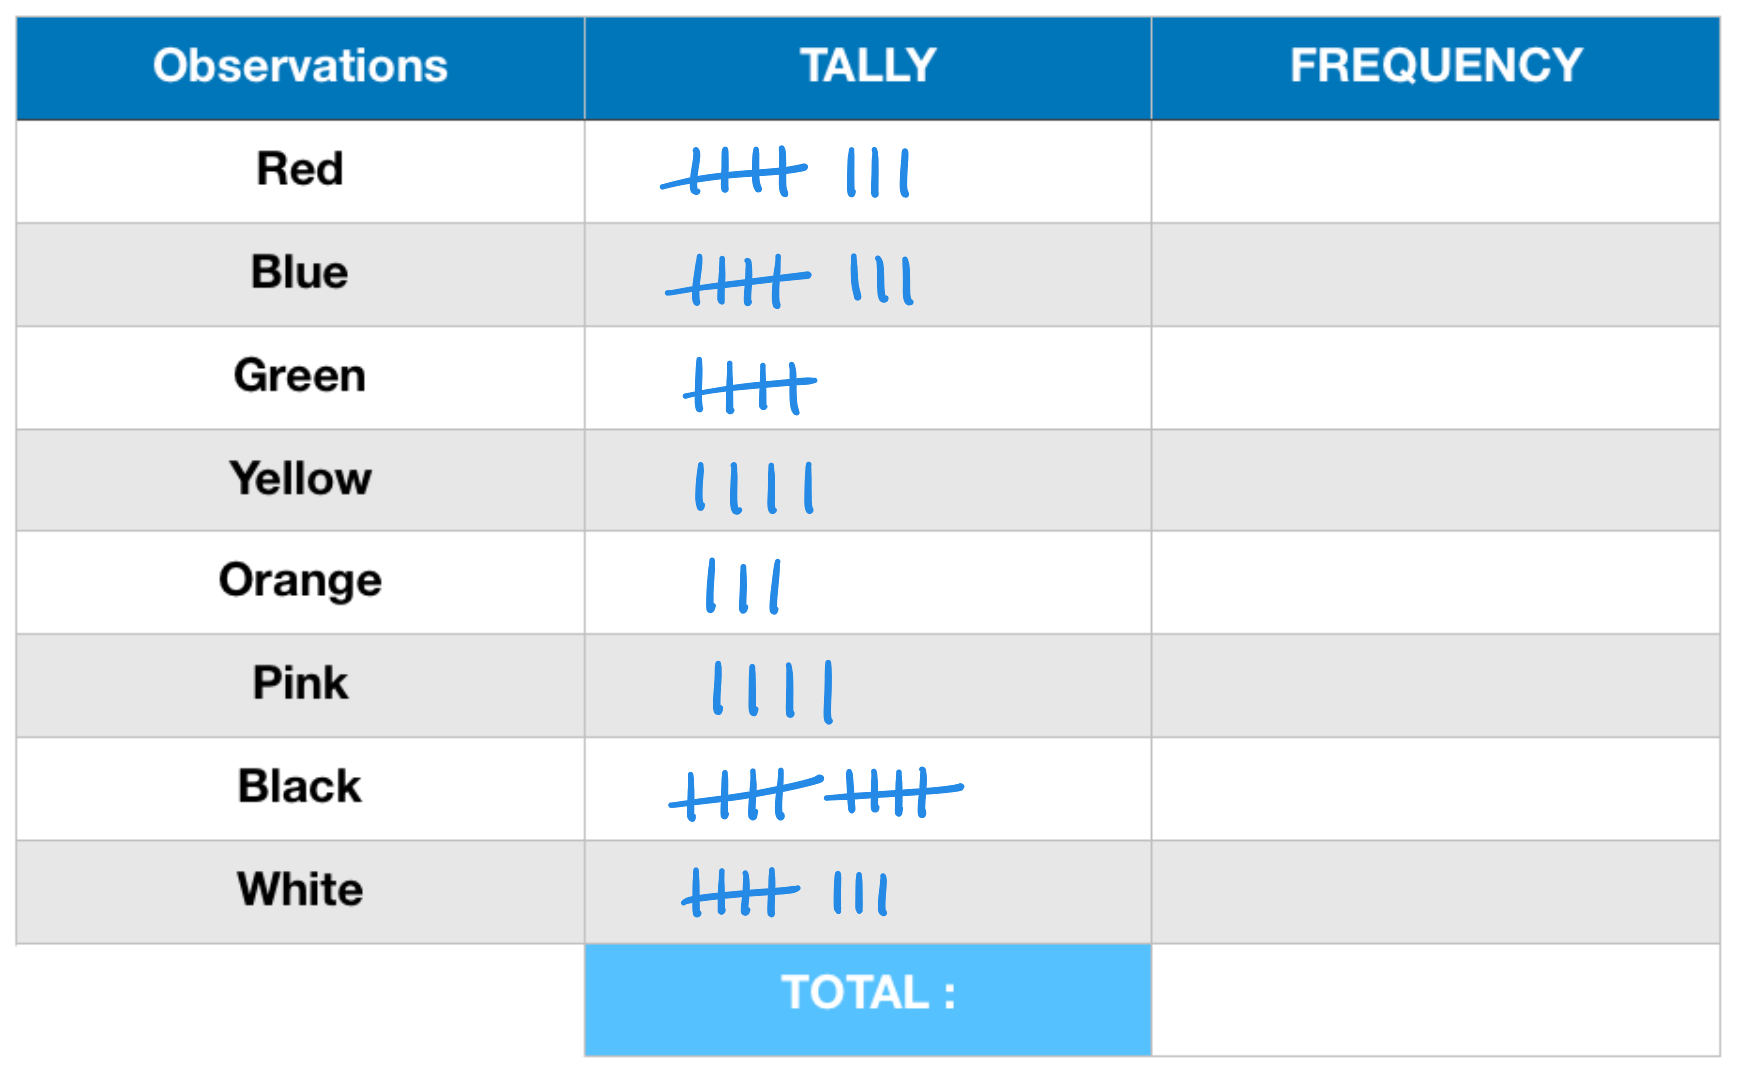
- Step 2: Complete the tally column by adding a "tick" in the appropriate row each time you come across a new data value.
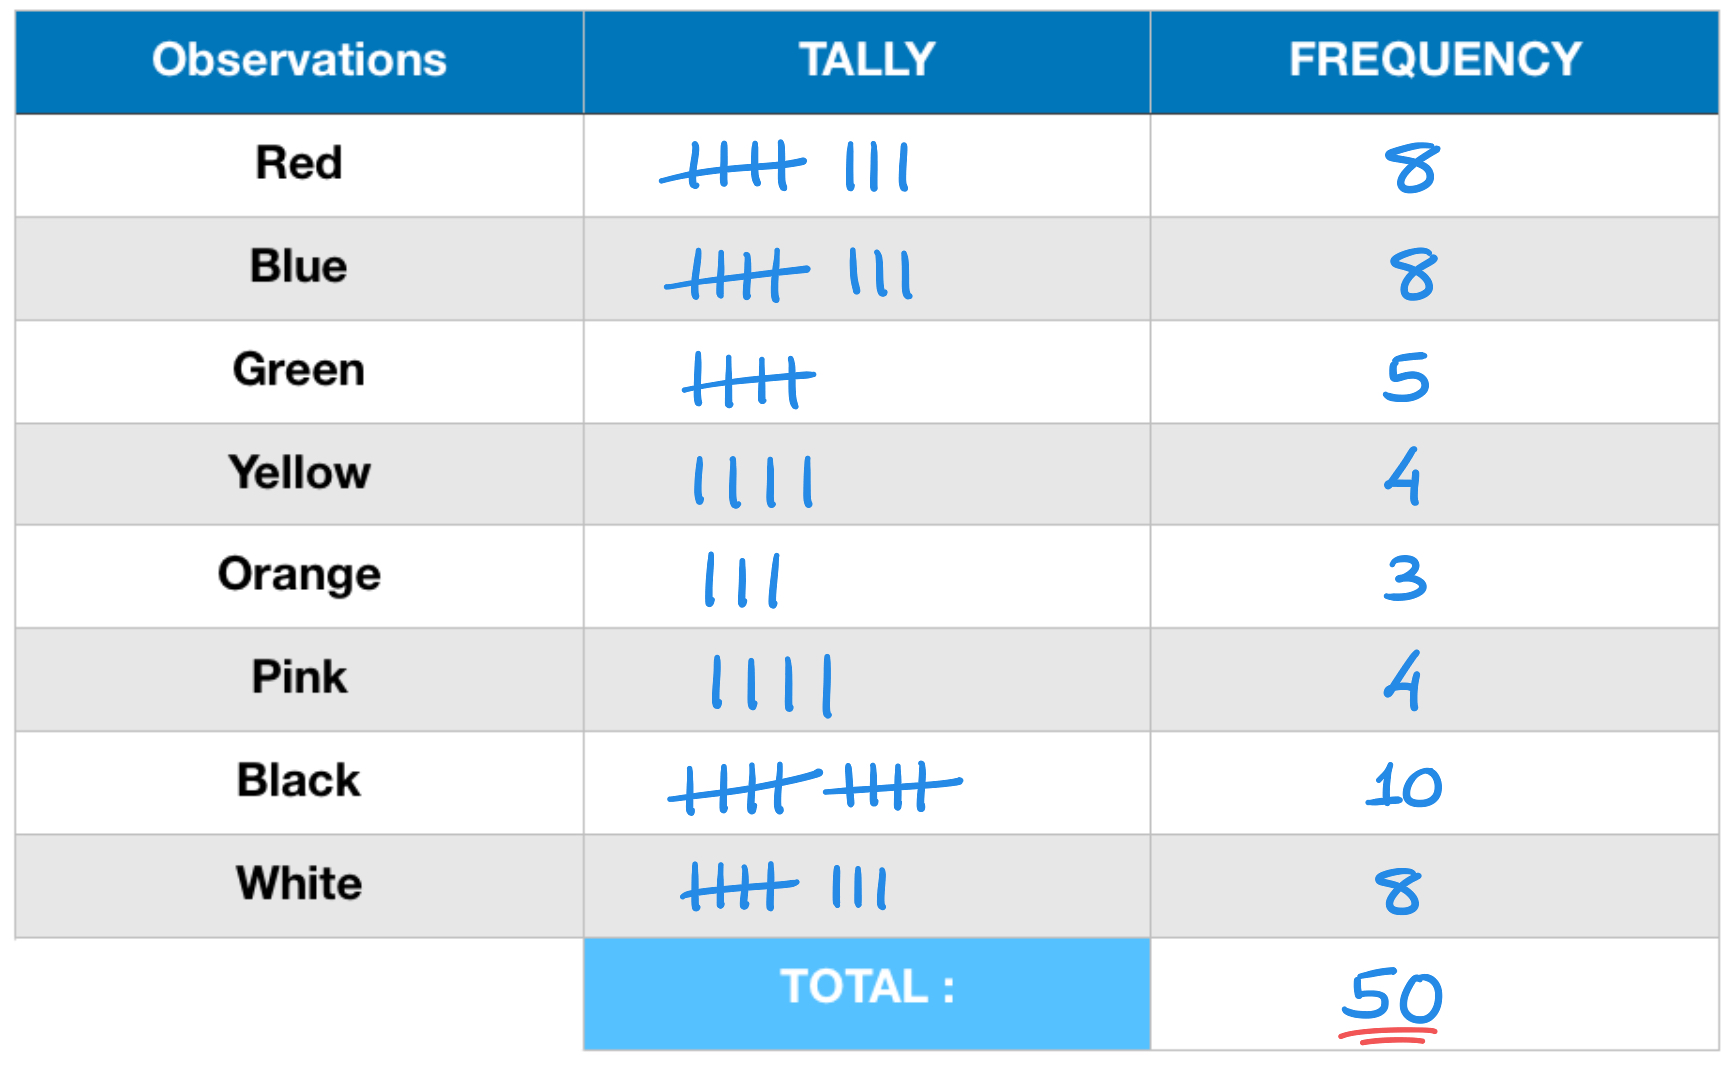
- Step 3: Complete the frequency column by counting the total number of ticks you see on each row; the frequency of each data value equals to the total number of ticks you see for that data value.
Example
In a survey \(50\) people were asked which color t-shirt they prefer, Red, Blue, Green, Yellow, Orange, Pink, Black or White.
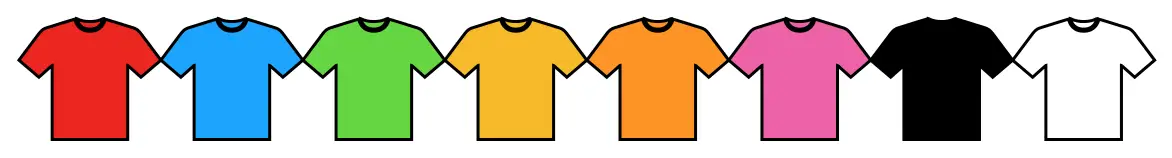
The raw data (before any organizing is done) is shown here:
Tutorial
Exercise
-
A sports club orders \(30\) jerseys for its students. The possible sizes are:
Extra Small (XS), Small (S), Medium (M), Large (L), Extra Large (XL). After asking each student to write their size on a sheet of paper the club owner is faced with the following raw data:S, XS, L, M, XL, M, M, M, S, L, L, XS, XL, M, XL, S, XS, L, M, M, S, L, M, M, M, S, S, L, XS, L Using a tally chart, summarize this data in a frequency table. -
\(30\) students sat the same mathematics test, which was graded out of \(10\). The grades obtained are shown here:
9, 10, 9, 9, 8, 5, 6, 4, 4, 7, 6, 2, 10, 5, 8, 9, 7, 6, 7, 8, 5, 4, 1, 9, 9, 8, 6, 7, 10, 1. Construct a frequency table to summarize these results. -
A mini golf owner wishes to better target his weekend customers. To do that he starts by observing the age group of the customers entering the gold on a Saturday.
Each time a customer enters the mini golf he makes a note of whether they are:child (C), teenager (T), young adult (Y), middle-aged (M), senior (S) By the end of Saturday morning, the raw data the owner collected was:Y, C, C, T, S, T, T, M, Y, Y, M, C, C, C, T, S, M, Y, T, S, Y, T, S, T, Y, C, T, T, M, T, C, T, S, C, C, Y - Construct a frequency table for this data.
- How many people went visited the mini golf that Saturday morning?
-
The number of goals scored in each game of a football (soccer) tournament are listed, below, in the order in which the games took place:
5, 3, 1, 5, 0, 2, 4, 1, 2, 4, 0, 4, 4, 1, 0, 3, 1, 4, 2, 1, 4, 3, 1, 1, 3, 5, 1, 2, 2, 4
Answers Without Working