Mean, Median, Mode : 3 Types of Average
(Measures of Central Tendancy)
The measures we learn about here are:
- mean (what we commonly call the "average")
- median
- mode
Formula : the Mean \(\bar{x}\)
Given \(n\) values of data, \(x_1\), \(x_2\), \(x_3\), ... we calculate the mean \(\bar{x}\) using: \[\bar{x} = \frac{x_1 + x_2 + \dots + x_n}{n}\] A more formal way of writing this is: \[\bar{x} = \frac{\sum_{i=1}^n x_i}{n}\] where:
- \(\sum_{i=1}^n x_i\) refers to the sum of all the values (from the 1st to the n-th)
- \(n\) is the number of values
Example
10 students sat a mathematics quiz, graded out of 20. The results obtained were: \[13,17,8,20,1,4,12,15,19,3\] Calculate the mean grade.
Solution
Since there are \(10\) students, \(n=10\).
Using the formula for the mean we calculate \(\bar{x}\) as follows: \[\begin{aligned} \bar{x} & = \frac{13+17+8+20+1+4+12+15+19+3}{10} \\ & = \frac{112}{10} \\ \bar{x} &= 11.2 \end{aligned}\] The mean grade obtained was 11.2 out of 20.
THE MEDIAN
Given a list of data, written/organized in increasing order (from smallest to largest) the median value is the middle value.
- \(50 \%\) of the data is greater than or equal to it
- \(50 \%\) of the data is less than or equal to it
Tutorial : Median Value
How to Find the Median
Given a list of data we can find/locate the median value as follows:
- Step 1: make sure the data is written in increasing order.
- Step 2: locate the median value, using the formula: \[\text{position of Median}= \frac{n+1}{2}\]
- if \(n\) is an odd number, so we're dealing with an odd number of values, then there will be a middle value and that will be the median.
- if \(n\) is an even number then there will be two middle values and the median will be the mean of those two values.
Tutorial : Median Value
In this tutorial we see how to find the median value for the following two lists of numbers:
Example
Two different math classes sat a math quiz, graded out of 20. The results obtained by each class are:
- Class 1 grades: \[14,9,11,12,17,8,18,10,14\]
- Class 2 grades: \[13,17,8,20,1,4,12,15,19,3\]
Solution
We take care of each of the classes separately:
-
Class 1
\[14,9,11,12,17,8,18,10,14\]
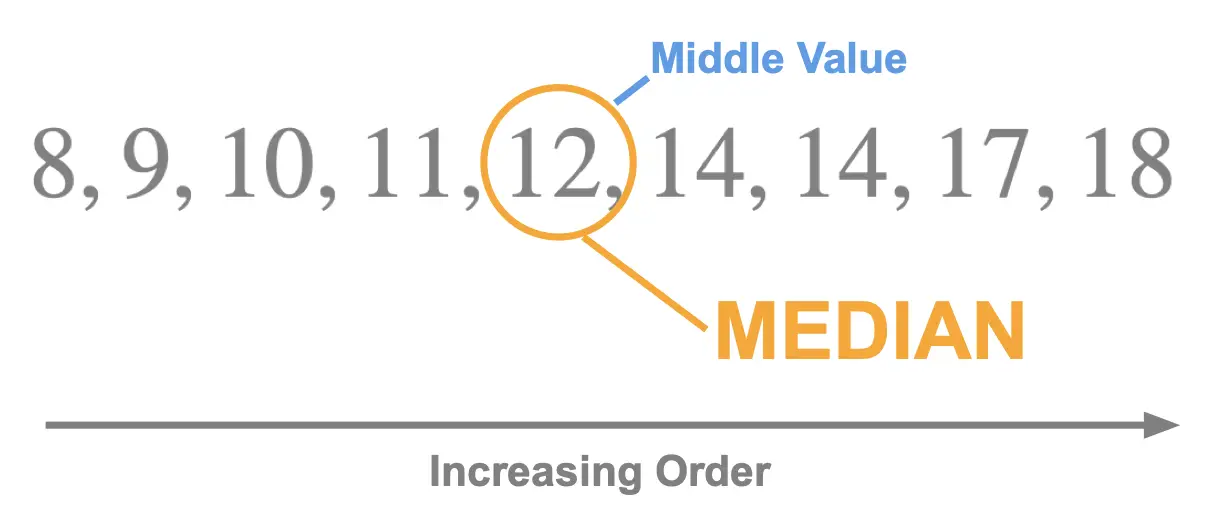
- Step 1: we start by writing all the values in increasing order: \[8,9,10,11,12,14,14,17,18\]
-
Step 2: we find the position of the median value using the formula \(\frac{n+1}{2}\). There are 9 grades from Class 1, so \(n=9\). The formula leads to:
\[\begin{aligned} \text{Position of Median}& = \frac{n+1}{2} \\
& = \frac{9+1}{2} \\
& = \frac{10}{2} \\
\text{Position of Median} & = 5 \end{aligned}\]
This 5 tells us that the median is in the 5th position as we go from left to rightGoing from left to right in our list of values, written in increaing order, we can see that the 5th value is \(12\) so:
\[\text{Median}=12\]
-
Class 2
\[13,17,8,20,1,4,12,15,19,3\]
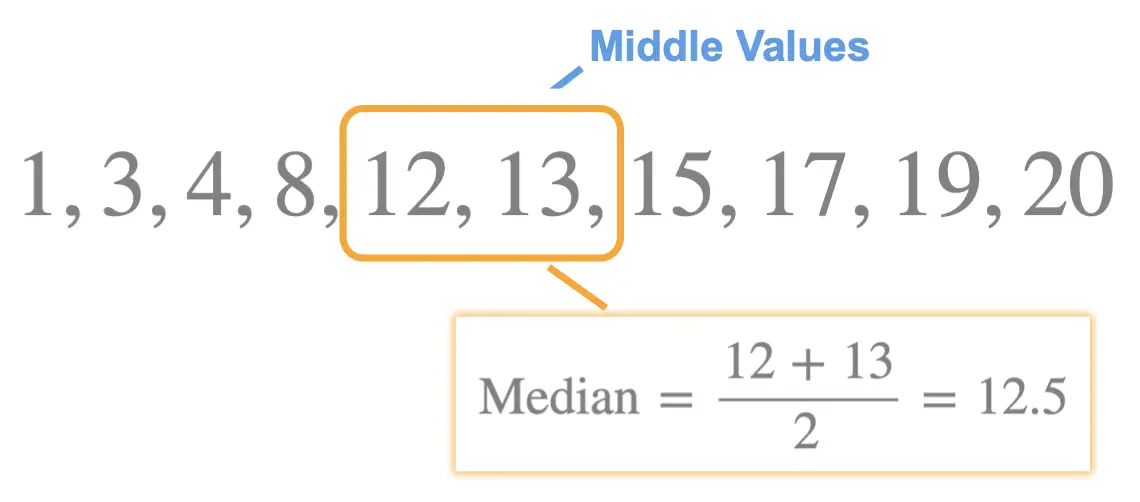
- Step 1: we start by writing all the values in increasing order: \[1, 3, 4, 8, 12, 13, 15, 17, 19, 20\]
-
Step 2: we find the position of the median value using the formula \(\frac{n+1}{2}\). In this case, there are 10 grades from Class 2, so \(n=10\). The formula leads to:
\[\begin{aligned} \text{Position of Median}& = \frac{n+1}{2} \\
& = \frac{10+1}{2} \\
& = \frac{11}{2} \\
\text{Position of Median} & = 5.5 \end{aligned}\]
5.5 lies between the 5th and 6th values. This tells us that the median is the mean of the 5th and 6th vales (the middle values):
\[\begin{aligned} \text{Median} & = \frac{12+13}{2} \\
& = \frac{25}{2} \\
\text{Median} & = 12.5
\end{aligned}\]
MODE
The mode is another measure of central tendancy in other words the mode is another type of average.
Mode: Definition & How to Find It
Given a list of data, the mode is the number which appears the most.
A more formal way of saying that could be:
Example
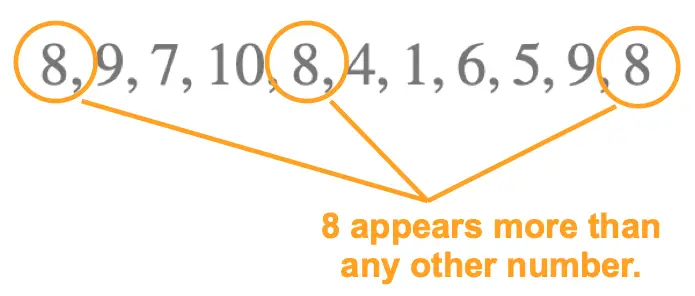
At a test (scored out of 10) a group of students obtained the following grades: \[8,9,7,10,8,4,1,6,5,9,8\] State the value of the mode.
Solution
Looking at the list of scores obtained we can see that 8 occurs most frequently:
When there's more than one Mode: Plurimodal (Multimodal) Data
If two ore more values appear an equal number of times we say that the data is plurimodal (or multimodal).
Example
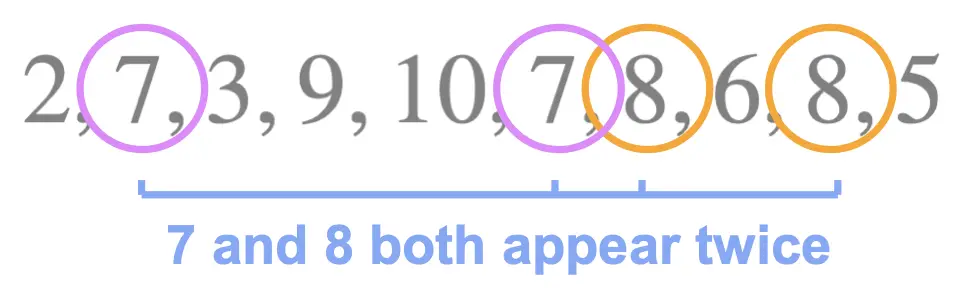
At a math test (scored out of 10) students obtained: \[2,7,3,9,10,7,8,6,8,5\] Find the mode.
Solution
Looking at the scores obtained we can see that both 7 and 8 occur twice, which is more than any other value:
Scan this QR-Code with your phone/tablet and view this page on your preferred device.

Subscribe Now and view all of our playlists & tutorials.