Introduction to Probabilities
(Terminology, Definitions, Venn Diagrams & Probability of a Single Event)
Probabilities are the study of "chance". When we calculate the probability of something occurring we are calculating the likelihood of it happening.
Studying probabilities will allow us to answer questions like:
- What is the probability of rolling an even number with a dice?
- What is the probability of winning the lottery?
- What is the probability of picking two red balls from a bag with 4 red balls and 6 green balls?
- What is the probability that it will rain in Ireland on Febrary 14th?
Definition of a Probability
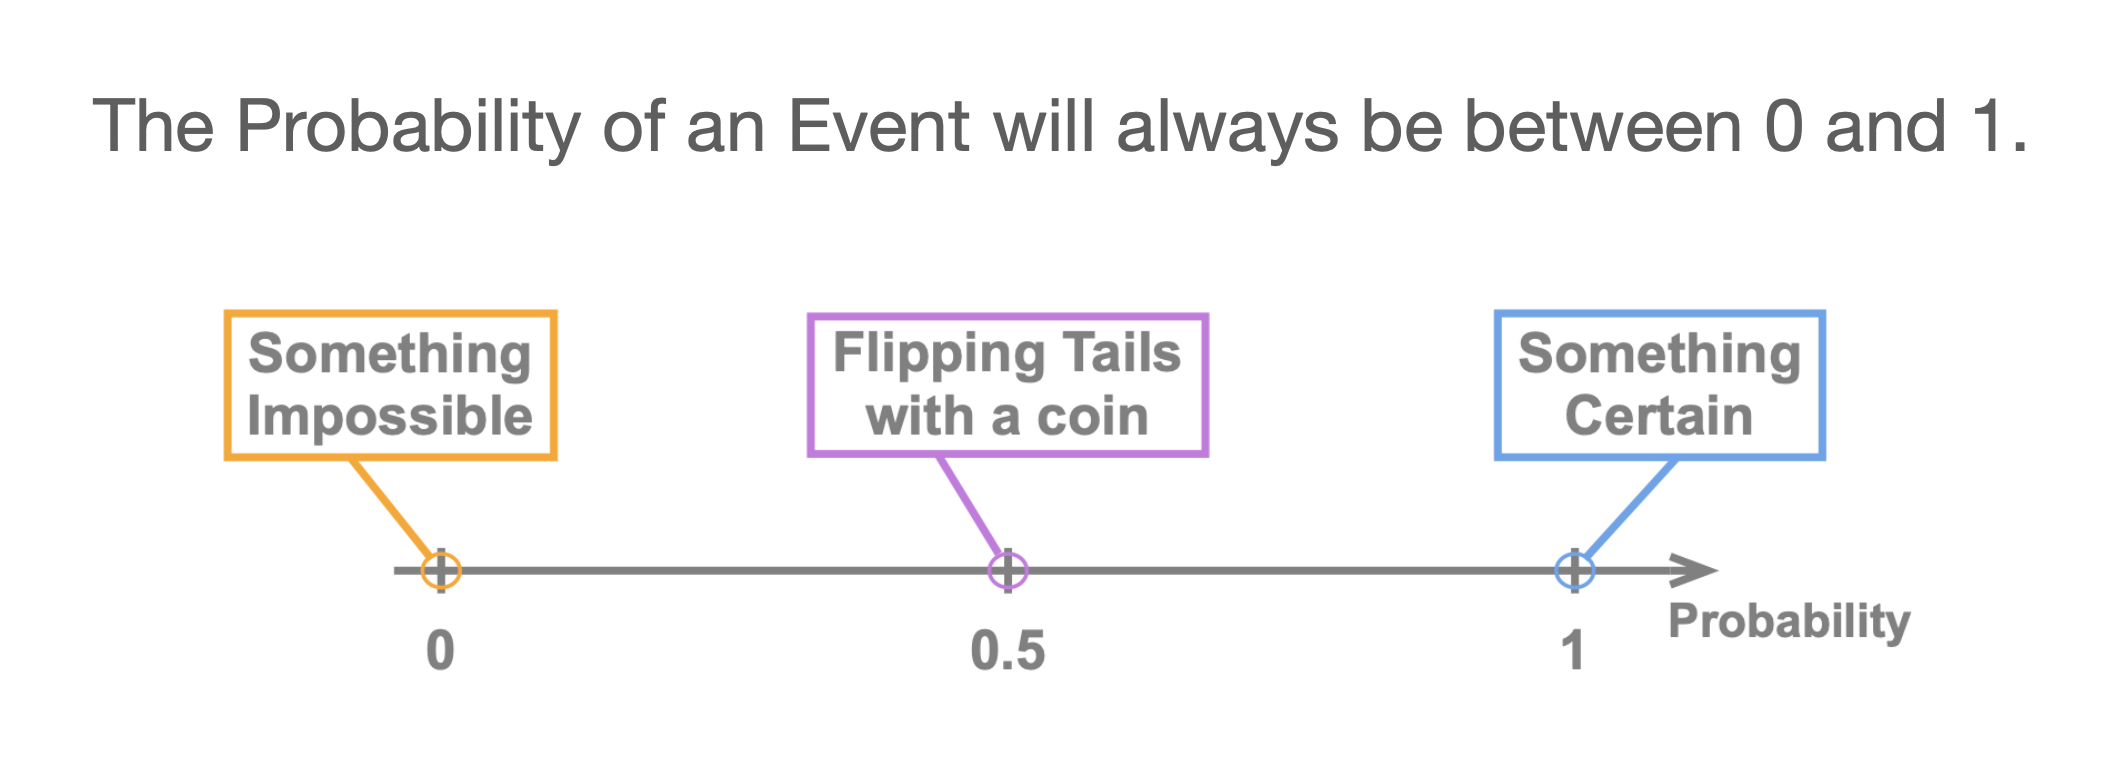
A probability is a measure of the likeliness of an event, which depends on chance, occurring. All probabilities are measured on a scale from \(0\) to \(1\), where:
- An event whose probability is \(0\) is an impossible event (something that cannot happen).
- An event whose probability os \(1\) is an event that is certain to occur.
- The probability of flipping Tails with an unbiased coin is \(p\begin{pmatrix}\text{Heads}\end{pmatrix} = \frac{1}{2} = 0.5\).
- The probability of rolling a \(6\) with a single die is \(p\begin{pmatrix}\text{Six}\end{pmatrix} = \frac{1}{6} \approx 0.17\).
- The probability of flipping tails twice in a row with an unbiased coin is \(p\begin{pmatrix}\text{2 Tails in a Row}\end{pmatrix} = \frac{1}{4} = 0.25\).
Experiments & Outcomes
In probabilities, an experiment is a process (could be "anything") in which there are one or more (usually more) possible outcomes each of which depends on chance.
EXAMPLES
The following table lists some experiments with their corresponding outcomes:
| EXPERIMENT | OUTCOMES |
|---|---|
| Flipping an unbiaed (a fair) coin. | There are 2 possible outcomes: Heads or Tails. |
| Rolling a six faced die and making a note of the result. | The possible outcomes are: \(1\), \(2\), \(3\), \(4\), \(5\) or \(6\). |
| Picking a marble, at random, from a bag containing \(3\) orange marbles and \(4\) green marbles. | The possible outcomes are: picking an orange marble or picking a green marble. |
Events in Probability
Given an experiment, an event refers to either:
- one specific outcome
- a combination of several outcomes
We'll usually refer to events using a capital letter, \(A\), \(B\), \(C\), ... .
EXAMPLES
Here are a few examples of experiments, their outcomes, and some of the events we may be interested in:
| EXPERIMENT | OUTCOMES | EVENTS |
|---|---|---|
| Flipping an unbiaed (a fair) coin. | There are 2 possible outcomes: Heads or Tails. | We could define the events:
|
| Rolling a six faced die and making a note of the result. | The possible outcomes are: \(1\), \(2\), \(3\), \(4\), \(5\) or \(6\). |
We could define the events:
|
| Picking a marble, at random, from a bag containing \(3\) orange marbles and \(4\) green marbles. | The possible outcomes are: picking an orange marble or picking a green marble. | We could define the two events:
|
Sample Space
Sample Space
Given an experiment, the sample space tells us, or shows us, all of the possible outcomes. The possible outcomes are often written in between curly braces \( \{ \text{outcome 1, outcome 2,} \cdots \} \).
Examples
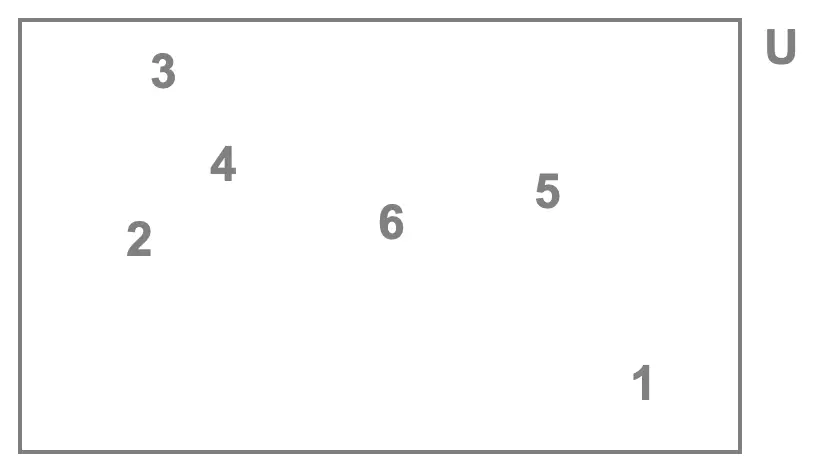
- When we flip a coin there are two distinct possible outcomes, Heads (H) and Tails (T). In this case we could say that the sample space is: \[U = \{H,\ T \}\] Note: we'll often call the sample space \(S\) or \(U\) (to refer to the Universal Set, defined with Venn diagrams further down).
- When we roll a singke die and look at the number we obtained, there are \(6\) possible outcomes: \(1\), \(2\), \(3\), \(4\), \(5\) and \(6\). We can state that the sample space is: \[U = \{1, \ 2, \ 3, \ 4, \ 5, \ 6 \}\]
Venn Diagrams (for Probabilities)
Given an experiment, we'll often use a Venn diagram to illustrate:
- all of the possible outcomes
- the events we're interested in.
Example
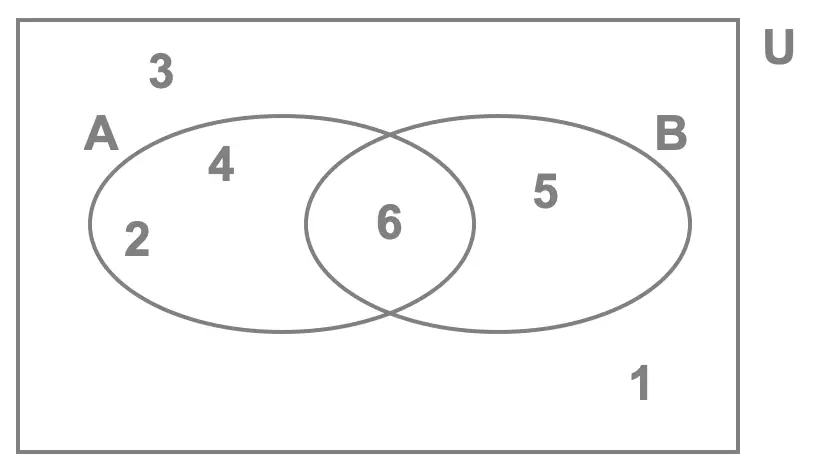
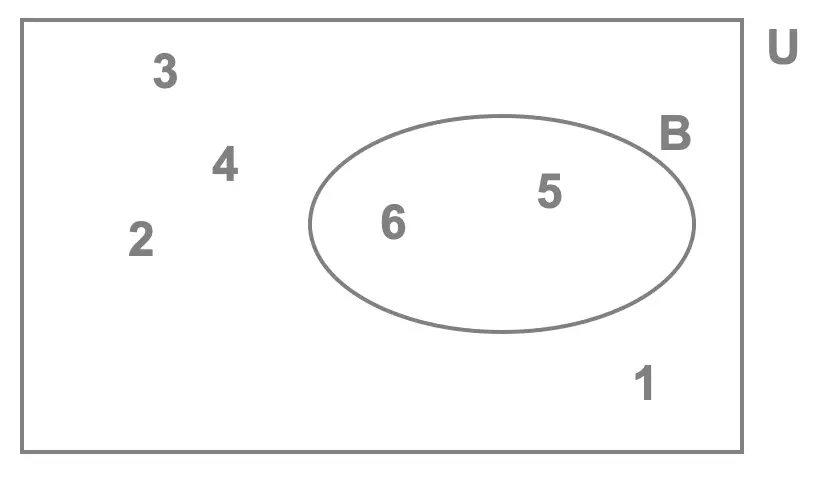
Say we're rolling a single die and looking at the number obtained and that we're interested in the events:
- \(A\): rolling an even number
- \(B\): rolling a number greater than \(3\).
Venn Diagram 1
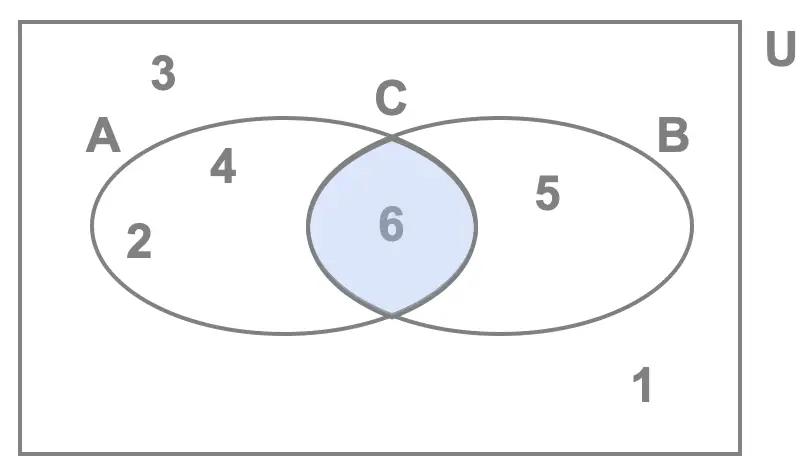
Venn Diagram 2
Number of Ways an Event Can Occur = Number of Elements in a Set
As we're about to see, further down, when calculating the probability of an event ocurring we'll need to find the number of ways that event can occur in the experiment.
If we're using a Venn diagram, then the number of ways an event \(A\) can occur is equal to the number of elements in set \(A\) on the Venn diagram.
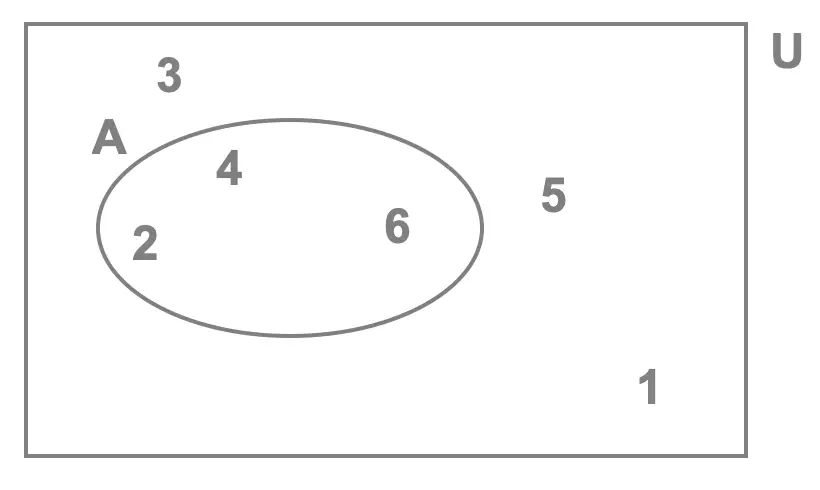
Looking back at the Venn diagram we created, above, and the two events:
- \(A\): rolling an even number
- \(B\): rolling a number greater than \(4\).
- \(3\) elements inside set \(A\), we write \(n\begin{pmatrix}A \end{pmatrix} = 3\), so the number of ways event \(A\) can occur is \(3\)
- \(2\) elements inside set \(B\), we write \(n\begin{pmatrix}B \end{pmatrix} = 2\), so the number of ways event \(B\) can occur is \(2\)
Probability of a Single Event
Given an experiment as well as an event \(A\), we calculate the probability of event \(A\) occurring with the formule: \[p\begin{pmatrix}A\end{pmatrix} = \frac{n \begin{pmatrix}A \end{pmatrix}}{n\begin{pmatrix}U\end{pmatrix}}\] where:
- \(n\begin{pmatrix}A\end{pmatrix}\) refers to the numbers of ways event \(A\) can occur. On a Venn Diagram that equals to the number of elements inside set \(A\).
- \(n\begin{pmatrix}U\end{pmatrix}\) refers to the total number of possible outcomes in the experiment. On a Venn Diagram that equals to the total number of elements inside set \(U\).
Example
Clara rolls un unbiased die and looks at the number she rolls.
- Find the probability that she rolls a \(5\).
- Find the probability that she rolls an even number.
- Find the probability that she rolls a number greater than \(4\)
- Find the probability that she rolls a number that is both: an even number and greater than \(4\).
SOLUTION
-
 If we define the event:
- \(D\): rolling a 5
-
 We start by defining the event:
- \(A\): rolling an even number.
-
 We start by defining the event:
- \(B\): rolling a number greater than \(4\)
-
 We start by defining the event:
- \(C\): rolling an even number greater than \(4\)
When rolling a die there are \(6\) possible outcomes. Indeed Clara could roll a \(1\), \(2\), \(3\), \(4\), \(5\) or \(6\). So before answering any of the questions we can already state:
\[n\begin{pmatrix}U \end{pmatrix} = 6\]
That's the total number of elements we see in the Venn diagram shown here.
In the next section, we learn more about the probability of a single event, click on the button below to learn more.
Scan this QR-Code with your phone/tablet and view this page on your preferred device.

Subscribe Now and view all of our playlists & tutorials.